

 Save
Save Print
Print

The 22nd China Ferro-alloys International Conference, host ed by Ferro-Alloys.com, will be held on 20 May to 22 May, 2026 in Beijing city, China. We sincerely invite you jointly explore the development ferroalloys trend in 2026. Why Attend?
[Ferro-Alloys.com] Jupiter Manganese Ore Quarterly Activities Report Q2 FY2026
Tshipi Highlights
867,619 tonnes sold (4% increase on previous quarter, 27% increase on prior year corresponding period (PCP))
Production of 840,688 tonnes (1% increase on previous quarter, 13% increase on PCP)
Cost of production US$2.24 per dmtu FOB (1% decrease on previous quarter, 8% decrease on PCP)
Two LTIs in the quarter, TRIFR increased to 0.56 (last quarter 0.44)
Tshipi EBITDA of A$21.6m (19% decrease on previous quarter, 20% decrease on PCP)
Cash (A$137.4m) decreased by 2% from the previous quarter end, after first half FY2026 tax and royalty payments
Q2 FY2026 Quarterly Activities Report: Summary
The December 2025 quarter saw an increase to sales and production. Costs of production were lower, notwithstanding headwinds from the strengthening South African Rand and manganese prices were higher compared to the September quarter.
High-grade production increased by 10% on the previous quarter.
On-land logistics volumes decreased marginally (by 1%) during the quarter.
Tshipi EBITDA decreased by 19% compared to the previous quarter, mainly driven by foreign exchange movements. Cash decreased slightly after half-yearly tax and royalty payments.
The December 2025 quarter saw average (realised) manganese prices increase on the September 2025 quarter average (US$4.10/dmtu CIF, from US$3.86/dmtu CIF) as a result of increased consumption and seasonal restocking in China.
The spot price at 31 December 2025 was US$4.14/dmtu (CIF). At the end of January 2026 the spot price is US$4.32/dmtu (CIF), 4% higher than the price seen at the end of the December 2025 quarter.
Freight rates increased marginally to US$25.00 per tonne, at the end of the December 2025 quarter (Port Elizabeth to Tianjin) compared with US$24.70 per tonne at the start of the December 2025 quarter (1% increase). However, freight rates decreased by the end of January 2026 (US$23.40, a 6% decrease).
Tshipi Manganese Mine
Key production, sales and financial information for Tshipi for the quarter ended 31 December 2025, and comparatives, are presented below:
|
Key Statistic |
Unit |
Q2 FY2026 |
Q1 FY2026 |
YTD FY2026 |
Q2 FY2025 |
|
Production |
Tonnes |
840,688 |
829,798 |
1,670,486 |
745,167 |
|
Sales |
Tonnes |
867,619 |
837,577 |
1,705,196 |
683,090 |
|
Average CIF price achieved (HGL) |
US$/dmtu |
4.10 |
3.86 |
3.99 |
3.72 |
|
Average FOB price achieved (HGL) |
US$/dmtu |
3.36 |
3.18 |
3.24 |
3.02 |
|
Average FOB cost of production |
US$/dmtu |
2.24 |
2.27 |
2.25 |
2.43 |
|
Earnings before interest, tax and depreciation (EBITDA) |
A$ million |
21.6 |
26.6 |
48.2 |
26.9 |
|
Net profit after tax (NPAT) |
A$ million |
14.6 |
17.8 |
32.4 |
17.2 |
|
Cash at bank |
A$ million |
137.4 |
140.3 |
137.4 |
141.4 |
SAFETY AND SUSTAINABILITY
Two lost time injuries were recorded during the quarter, both being slip and fall incidents. TRIFR increased to 0.56 for the quarter (previous quarter 0.44) due to the two LTIs incurred as well as one medical treatment case during the quarter.
MINING AND PRODUCTION
|
|
Unit |
Q2 FY2026 |
Q1 FY2026 |
YTD FY2026 |
YTD FY2025 |
|
Mined volume |
|||||
|
bcm |
2,769,372 |
3,139,687 |
5,909,059 |
3,571,638 |
|
bcm |
189,922 |
199,769 |
389,691 |
283,142 |
|
Total |
|
2,959,294 |
3,339,456 |
6,298,750 |
3,854,780 |
|
Production |
|||||
|
Tonnes |
722,609 |
654,494 |
1,377,103 |
745,167 |
|
Tonnes |
118,079 |
175,304 |
293,383 |
- |
|
Total |
|
840,688 |
829,798 |
1,670,486 |
745,167 |
|
US$/dmtu |
2.24 |
2.27 |
2.25 |
2.43 |
Mining of graded ore decreased by 5%, while waste mining volumes decreased by 12% from the previous quarter. This was mainly due to seasonal rain and equipment availability.
Tshipi high-grade production increased by 10% and low-grade ore production decreased by 33%, with high-grade production prioritised to maximise the benefit of relatively positive market conditions.
Cost of production decreased 1% to US$2.24 on an FOB basis for the quarter (and 8% lower against the prior corresponding period). The main reasons for the decrease were marginally lower realised mining cost (due to the higher ore tonnes produced in the quarter) and royalties, which was partially offset by marginally higher logistics and overhead costs.
LOGISTICS AND SALES
|
|
Unit |
Q2 FY2026 |
Q1 FY2026 |
YTD FY2026 |
Q2 FY2025 |
|
On-land logistics |
Tonnes |
857,284 |
868,442 |
1,725,726 |
703,360 |
|
Sales |
|
|
|
|
|
|
Tonnes |
744,449 |
652,317 |
1,396,766 |
559,090 |
|
Tonnes |
123,170 |
185,260 |
308,430 |
124,000 |
|
Tonnes |
- |
- |
- |
- |
|
Total |
|
867,619 |
837,577 |
1,705,196 |
683,090 |
|
Average CIF price achieved (HGL) |
US$/dmtu |
4.10 |
3.86 |
3.99 |
3.72 |
|
Average FOB price achieved (HGL) |
US$/dmtu |
3.36 |
3.18 |
3.24 |
3.02 |
Logistics volumes decreased by 1% for the quarter. There was a major derailment on the Saldanha line during the quarter, which required further South African road haulage to be activated.
Sales volumes increased in the quarter by 4% and are on target for the full financial year plan.
CORPORATE AND FINANCIAL
Tshipi recorded an EBITDA of A$21.6 million and NPAT of A$14.6 million for the quarter, a decrease on the previous quarter (A$26.6 million and A$17.8 million, respectively). The decrease was mainly due to foreign exchange losses, with a provisional adjustment to historical logistics costs also made in the quarter.
During the quarter, the South African Rand strengthened against both the US Dollar and the Australian Dollar (4% and 3% increases, respectively, from end of Q1 FY2026 to end of Q2 FY2026). This reflected a combination of external factors, including movements in global risk sentiment, fluctuations in major currencies, and supportive commodity price dynamics, alongside periods of improved investor confidence toward emerging markets.
The performance of the Rand is expected to remain closely linked to global financial conditions, commodity price trends, and shifts in investor risk appetite. While supportive external factors may continue to provide periods of strength, ongoing domestic structural and political challenges are likely to contribute to volatility and limit sustained appreciation. As a result, the Rand is expected to trade within a broad range, with movements driven primarily by changes in global sentiment rather than domestic fundamentals alone.
Marketing and Market Outlook
JUPITER MARKETING
Sales and financial information for Jupiter’s marketing entity for the quarter ended 31 December 2025, as well as comparatives, are presented below.
The prices shown below relate to the prices realised by Jupiter’s marketing team for the 49.9% share of Tshipi sales that are marketed by Jupiter.
|
|
Unit |
Q2 FY2026 |
Q1 FY2026 |
YTD FY2026 |
Q2 FY2025 |
|
Sales |
Tonnes |
450,596 |
416,581 |
867,177 |
359,715 |
|
Average CIF price achieved (HGL) |
US$/dmtu |
4.07 |
3.91 |
4.03 |
3.72 |
|
Average FOB price achieved (HGL) |
US$/dmtu |
3.33 |
3.21 |
3.26 |
3.04 |
|
Marketing fee income |
A$ million |
2.3 |
2.0 |
4.3 |
1.9 |
|
EBITDA |
A$ million |
2.0 |
1.9 |
3.9 |
1.7 |
|
NPAT |
A$ million |
1.4 |
1.33 |
2.7 |
1.5 |
|
Cash at bank |
A$ million |
4.5 |
3.0 |
4.5 |
3.7 |
MARKET COMMENTARY AND OUTLOOK
Manganese ore prices, for both seaborne and portside cargo, showed a steady upward trend through the quarter.
Seaborne and portside prices for high-grade oxide ore increased more dramatically through the quarter compared to semi carbonate manganese ore prices. This was particularly in response to low port stock levels of high-grade oxide ore in China and reportedly declining export volumes.
Semi carbonate manganese ore prices edged up, leveraging high-grade price increases, particularly as the widening price differential further promoted consumption of semi carbonate manganese ore. Semi carbonate portside prices continued to trade on a relative basis to seaborne prices, leaving little margin for traders, and decreasing the appetite for higher seaborne quotations from major miners.
Towards the end of the quarter and post quarter end, manganese ore prices have been further assisted by seasonal restocking patterns prior to the Chinese Spring Festival in February 2026.
For China, the favourable strengthening of the Chinese Yuan against the US Dollar, through most of the quarter and continuing post quarter end, has further supported increased US Dollar denominated seaborne manganese ore prices.
Overall, manganese alloy production across China remained at elevated levels which promoted the consumption of manganese ore. However oversupply in the alloys market resulted in stagnant silico-manganese prices and declining margins for alloy producers.
With little change in manganese alloy output from the previous quarter, as well as a marginal quarter-on-quarter change in the volume of manganese ore which arrived in China, minimal changes in manganese ore stocks were noted. Total manganese ore stocks in China hovered between 4.3 – 4.4 million tonnes through most of the quarter, in line with the previous quarter however significantly lower than long term historical levels.
There was however a more notable change in the split of material across main ports in China, with material at Xinjiang port declining due to continued robust operating rates at alloy plants in Northern China and material at Qinzhou port climbing as operating rates at alloy plants in Southern China reportedly declined amid seasonally higher costs. There continues to be plant expansions across Northern China, particularly in Inner Mongolia, aimed at improving the viability of plants through greater reliance on renewable energy sources.
Manganese ore demand outside of China has continued existing trends, with volumes exported into India continuing to grow with partially offsetting weakness in Europe. Domestic demand and post monsoon season restocking has supported demand for manganese ore in India.
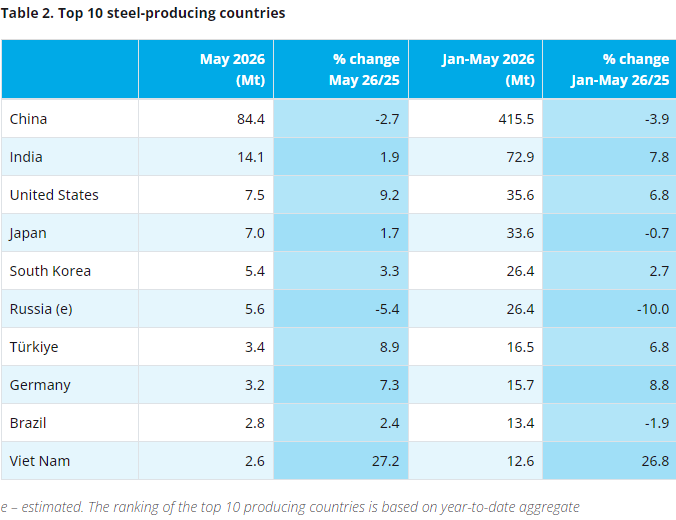
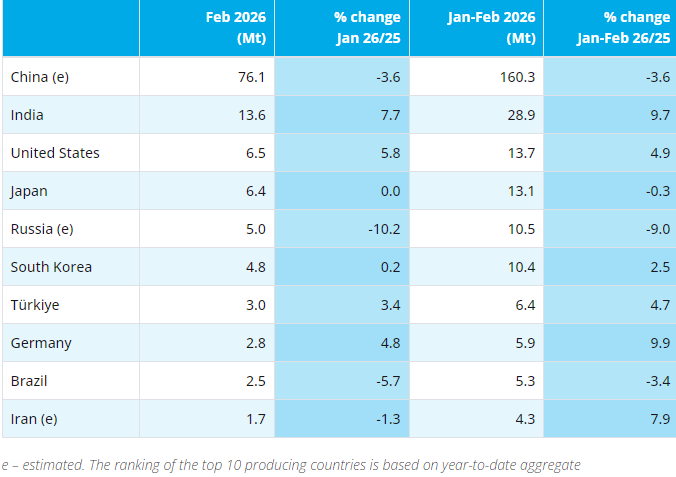
As per the Worldsteel Association, global crude steel production has continued to decline on both a quarterly and yearly comparative basis. Over these periods, the decline in crude steel production in China has outpaced the growth from the rest of the world.
Whilst China has reportedly met its GDP target of 5% for 2025, there was a notable slowdown in Q2 of FY2026. Infrastructure spending and more notably the property sector continues to adversely impact on the country’s economy, and the steel sector.
Outside of China, crude steel production growth in India remains robust driven by growing domestic demand as infrastructure spending and urbanisation continues.
|
Key market prices |
Unit |
Today (end Jan 2026) |
%change since 31 Dec 2025 |
31 Dec 2025 |
30 Sep 2025 |
30 Jun 2025 |
31 Mar 2025 |
31 Dec 2024 |
|
Mn ore 37% FOB Port Elizabeth |
US$/dmtu |
3.68 |
6.4% |
3.46 |
3.36 |
3.20 |
3.62 |
3.30 |
|
Freight rate Port Elizabeth to Tianjin (estimate) |
US$/dmtu |
23.40 |
(6.4%) |
25.00 |
24.70 |
22.96 |
23.70 |
24.00 |
|
Total stock at Chinese ports |
‘000 tonnes |
4,365 |
(1.0%) |
4,411 |
4,397 |
4,300 |
3,600 |
5,179 |
- [Editor:tianyawei]
 Daily News
 Research
 Magazine
 Company Database
 Customized Database
 Conferences
 Advertisement
 Trade
Trade


.jpg)

 Online inquiry
 Contact


Tell Us What You Think